Joins
The marketing manager is tired of seeing a transactions report using a stock code and having to look up the stock description in another report. Your task is to create an intelligent visualization between the two tables of data.
The solution is to join the stocks and transactions tables. A simple join is used when you have a common column between your tables. In this case, it is the stock code. The stocks table has the code column and it is stock_code in the transactions table.
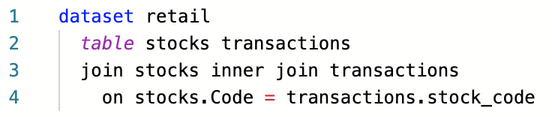
With bipp, you can easily specify the join in the dataset:
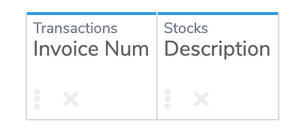
Now that you have the join between your tables, you can explore the data. In this case, your user wants a transactions report using the description from the stocks report. Here are your selections when you set up the visualization:
bipp generates the SQL for you behind the scenes:
SELECT t001.invoice_num AS _0, t000.description AS _1
FROM `online_retail`.`stocks` AS t000
JOIN `online_retail`.`transactions` AS t001
ON t000.code=t001.stock_code
GROUP BY 1, 2
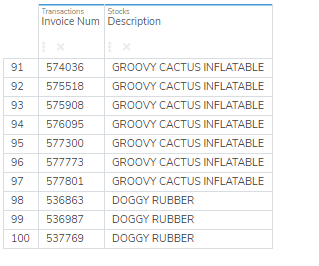
Fetching the data creates the report for your user: