bipp Visual SQL Data Explorer Gets You from Database to Charts in Minutes
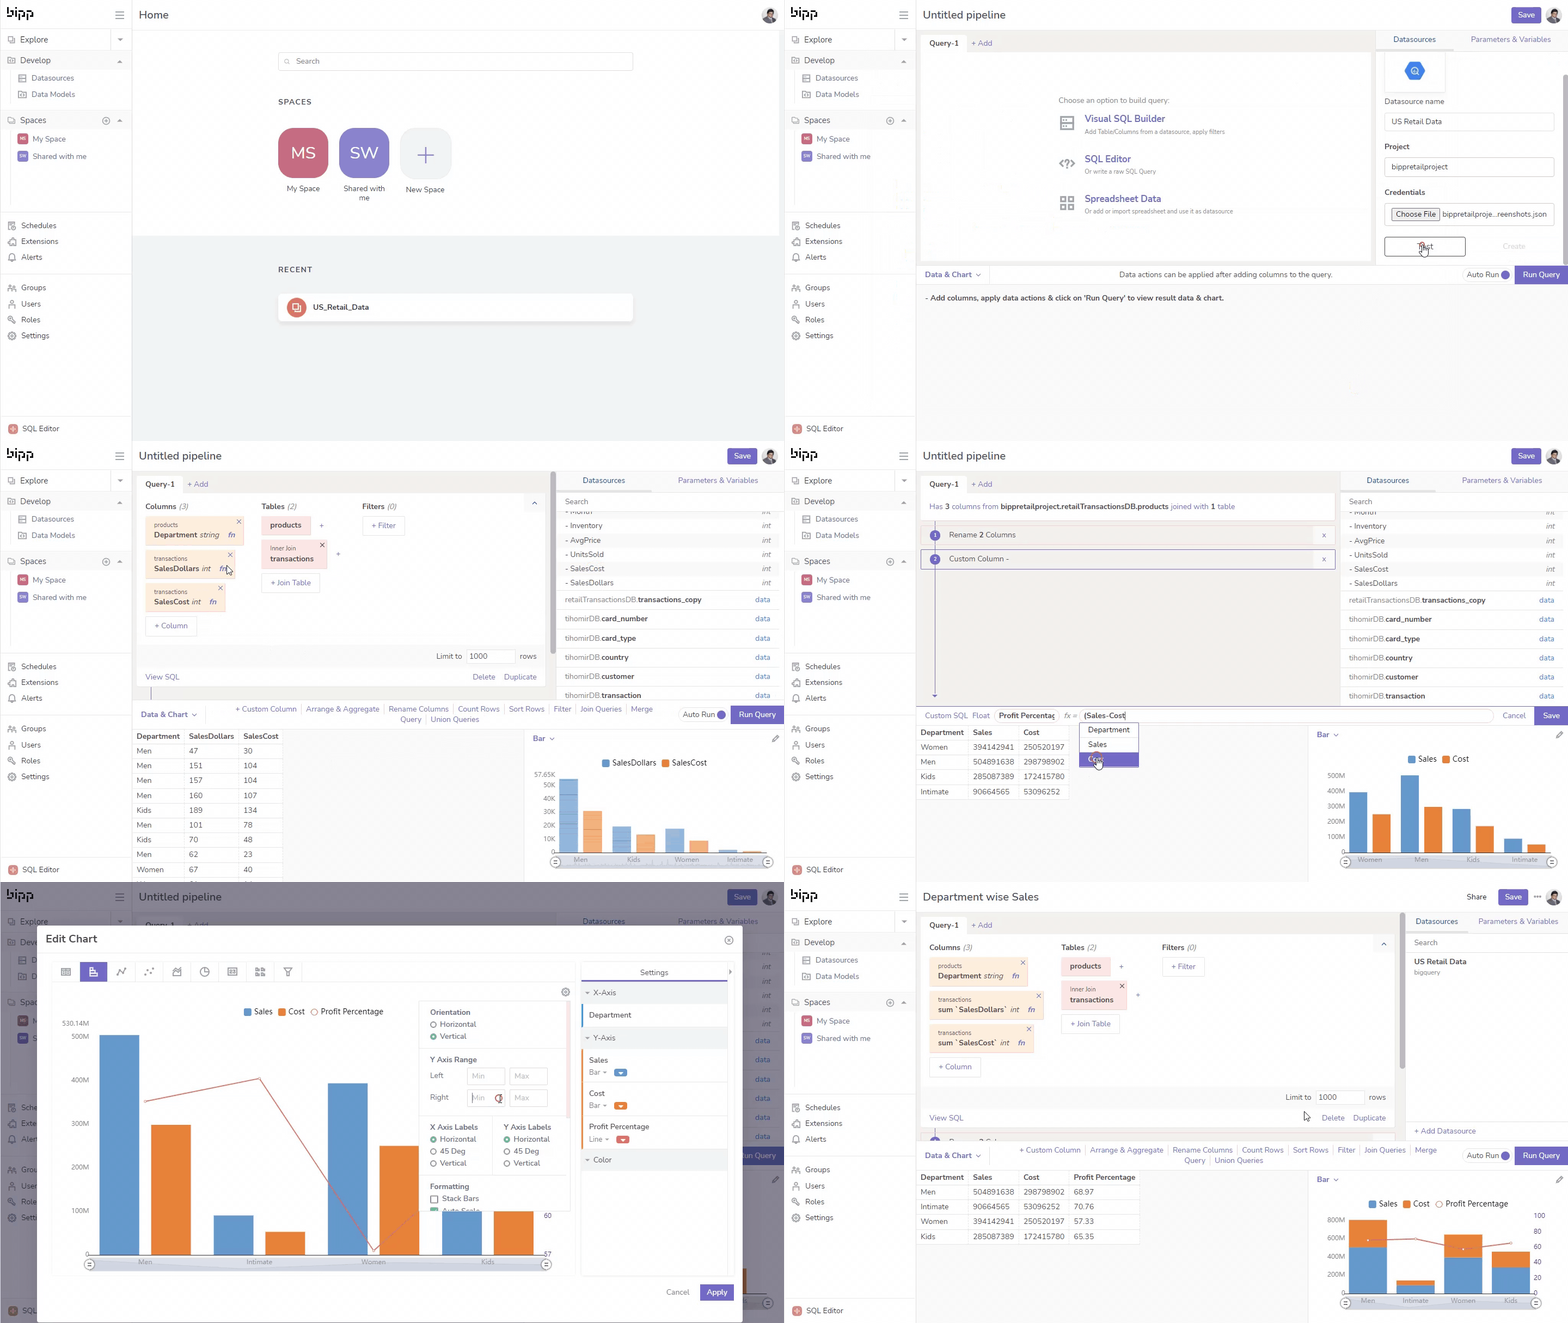
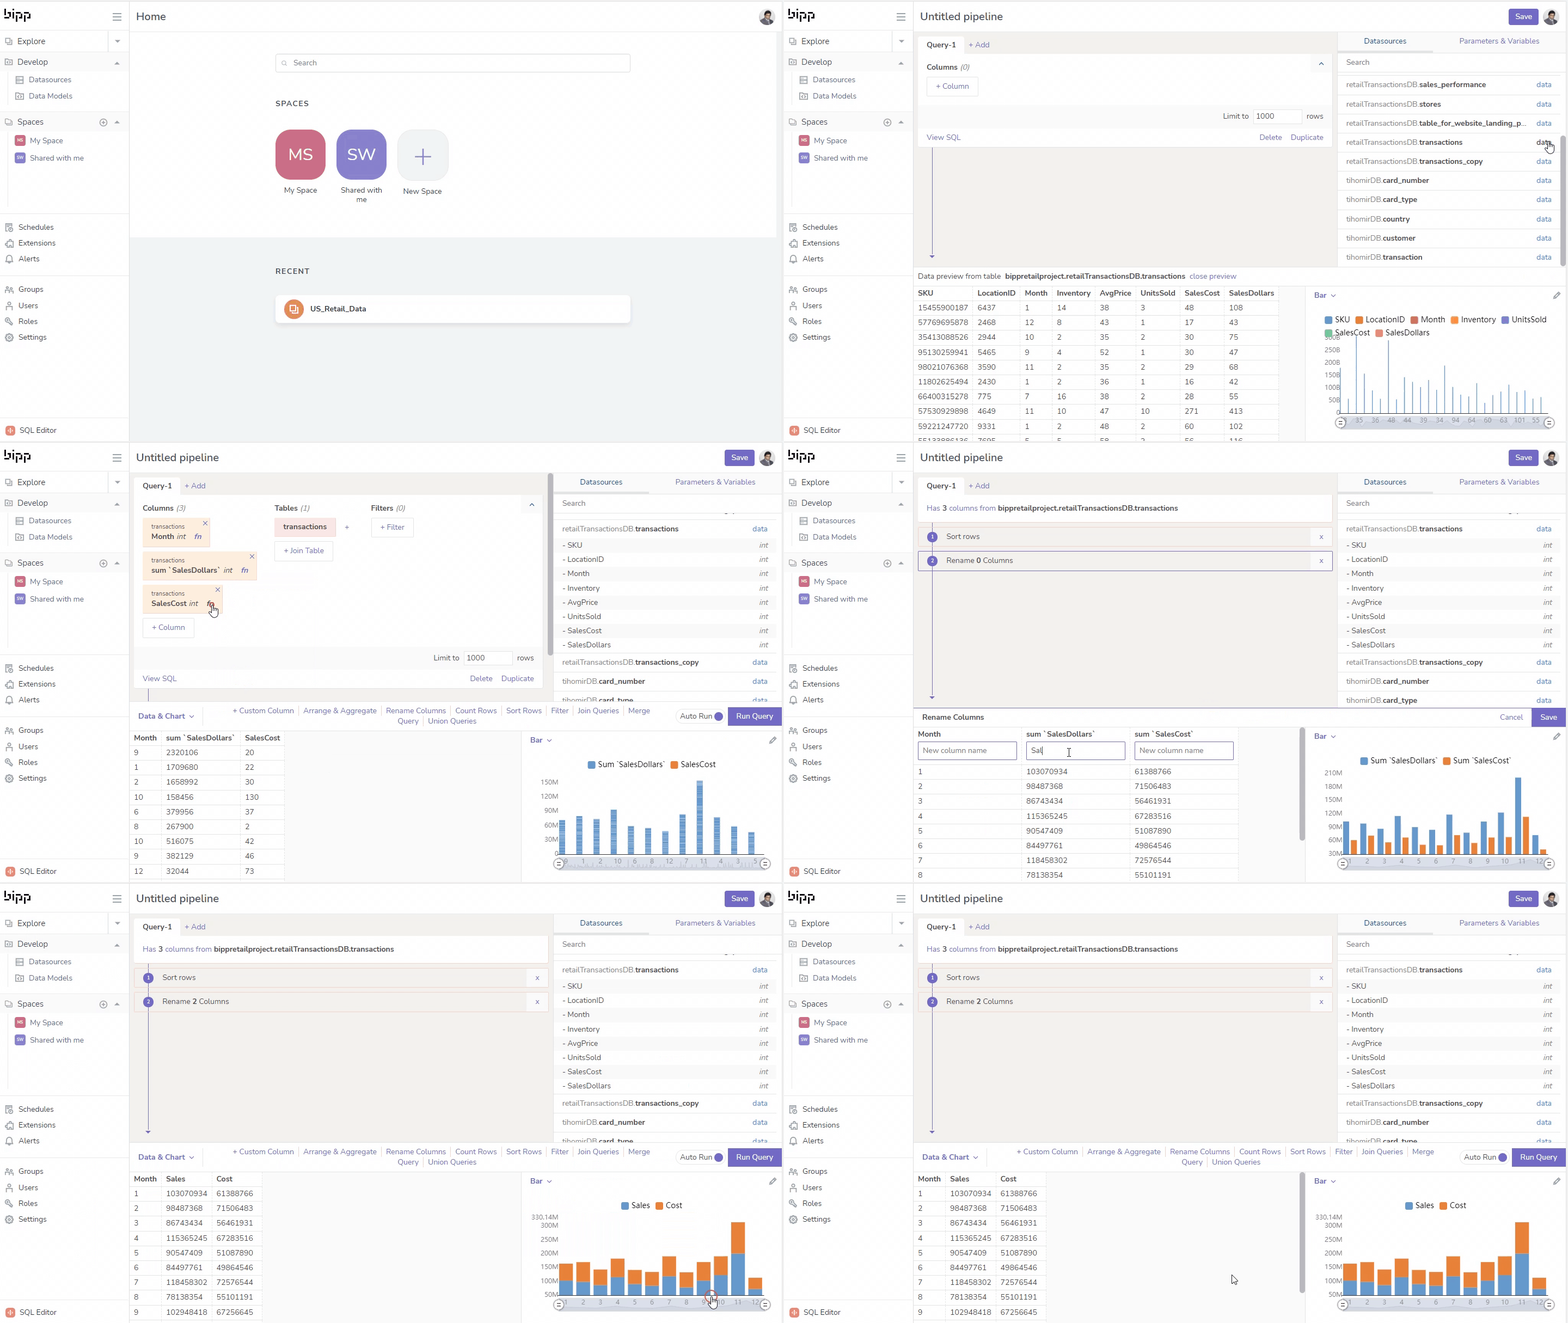
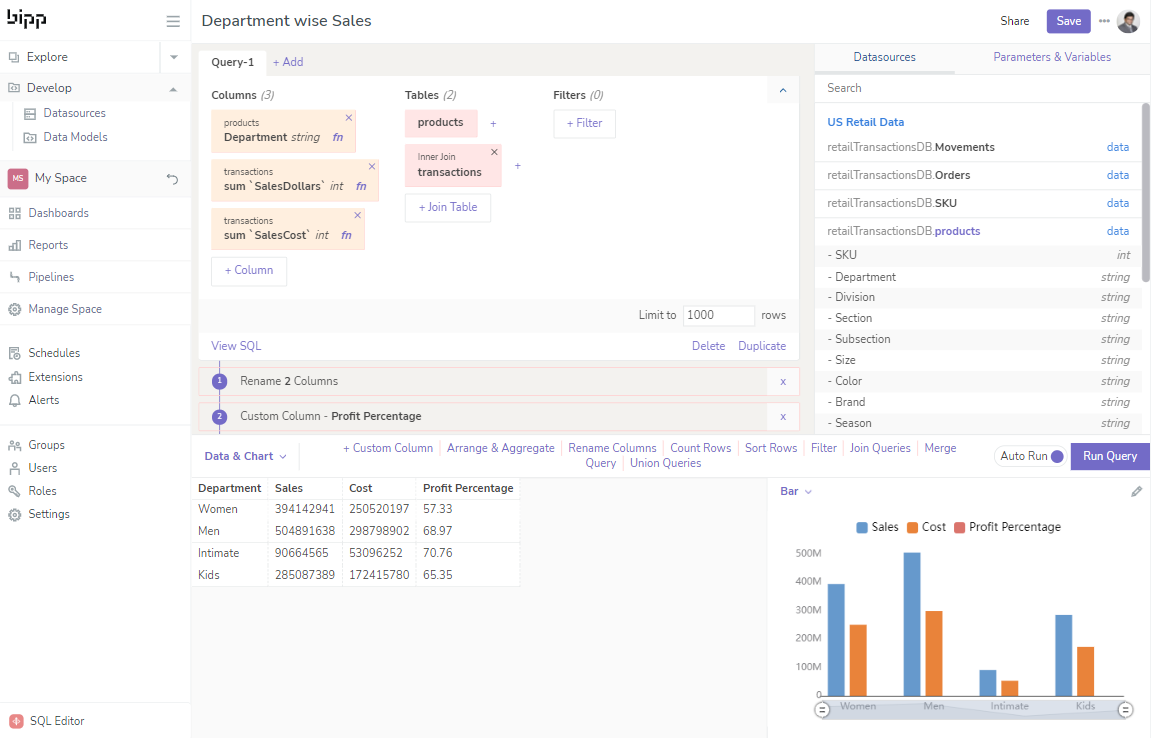
For the first time, bipp’s interface makes SQL visual, letting users query or explore data through a point-and-click interface and create and share charts in minutes, all without any programming.
Helps Small Teams Quickly Get Insights From Their Data
Small companies with modest analytics needs don’t always have dedicated data teams. They also want to quickly extract and manage data and build charts without needing programming knowledge. bipp Visual SQL Data Explorer was designed for small teams, and:
- Makes queries painless, thanks to the pure point-and-click functionality of a simple - yet powerful UI.
- Features built-in connections to leading databases including Amazon Redshift, Snowflake, Google BigQuery, Postgresql, Azure Synapse, MySQL, MS SQL Server, Oracle, and more.
- Lets you blend data and create charts from multiple data sources seamlessly, without going through an ETL pipeline, which speeds up ad hoc reporting and analysis.
- Includes powerful visualizations and lets you create interactive dashboards.
Helps Small Teams Quickly Get Insights From Their Data

Small companies with modest analytics needs don’t always have dedicated data teams. They also want to quickly extract and manage data and build charts without needing programming knowledge. bipp Visual SQL Data Explorer was designed for small teams, and:
- Makes queries painless, thanks to the pure point-and-click functionality of a simple - yet powerful UI.
- Features built-in connections to leading databases including Amazon Redshift, Snowflake, Google BigQuery, Postgresql, Azure Synapse, MySQL, MS SQL Server, Oracle, and more.
- Lets you blend data and create charts from multiple data sources seamlessly, without going through an ETL pipeline, which speeds up ad hoc reporting and analysis.
- Includes powerful visualizations and lets you create interactive dashboards.
Lets All Users Create Charts Without Any Coding
You shouldn’t have to learn a programming language to get insights from your data. Our no-code visual UI is intuitive for business users, saves power users time, and presents a flexible option for programmers. Unlike our competitors, bipp Visual SQL Data Explorer:
- Is purely built on SQL so no proprietary language is required to explore data and create and share charts.
- Features an intuitive, flexible drag-and-drop interface that allows users to explore and visualize data on their terms.
- Removes bottlenecks by making BI exploration easier and more intuitive for all users.
- Lets you switch to text-based SQL and modify it if you want to get hands-on.
Lets All Users Create Charts Without Any Coding

You shouldn’t have to learn a programming language to get insights from your data. Our no-code visual UI is intuitive for business users, saves power users time, and presents a flexible option for programmers. Unlike our competitors, bipp Visual SQL Data Explorer:
- Is purely built on SQL so no proprietary language is required to explore data and create and share charts.
- Features an intuitive, flexible drag-and-drop interface that allows users to explore and visualize data on their terms.
- Removes bottlenecks by making BI exploration easier and more intuitive for all users.
- Lets you switch to text-based SQL and modify it if you want to get hands-on.
Want to go from database to charts in minutes?


