Data Visualization Turns Data into Stories
Features Designed for You
Visualizations reduce time to insight by allowing slicing and dicing of data with dashboard updates reflected in real-time
Every report in bipp is a visualization format for data that can be saved and used in dashboards.
bipp reports support many different types of visualizations for the same data. They include tables, grid charts, bar and pie charts, maps, GMAPs, treemaps, and metrics.
We can also create custom visualizations to meet your unique needs.
Visualizations reduce time to insight by allowing slicing and dicing of data with dashboard updates reflected in real-time

Every report in bipp is a visualization format for data that can be saved and used in dashboards.
bipp reports support many different types of visualizations for the same data. They include tables, grid charts, bar and pie charts, maps, GMAPs, treemaps, and metrics.
We can also create custom visualizations to meet your unique needs.
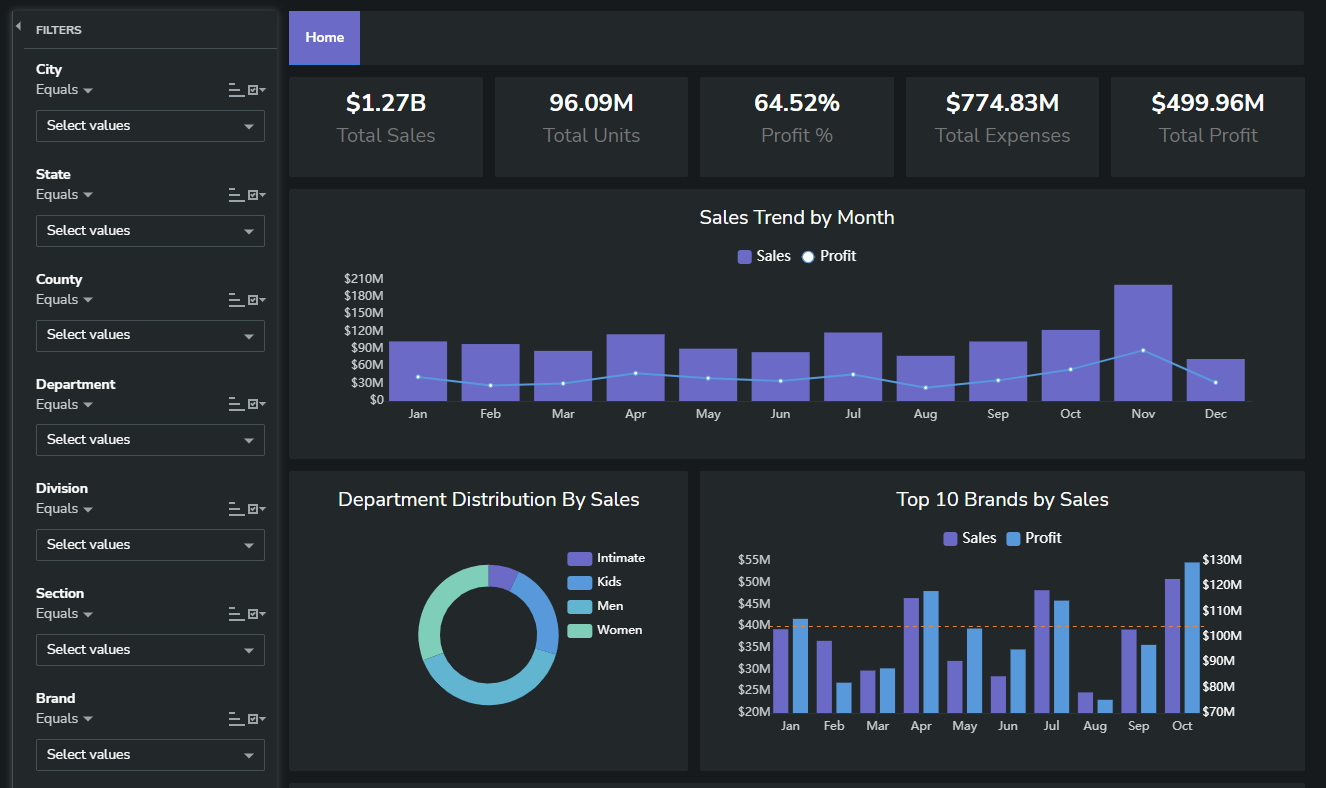
bipp’s dashboards are interactive and can act like data applications. They drive quick and accurate decision-making as users can monitor and measure performance in real time and provide focus on organizational or team KPIs
bipp allows creation and management of multiple dashboards that can be used to group and present one or many bipp reports.
They also allow data filtering across multiple reports and embedded dashboards and drill down into specific data points to view details.
bipp also provides a modern WYSIWYG editor for dashboard specifications.
bipp’s dashboards are interactive and can act like data applications. They drive quick and accurate decision-making as users can monitor and measure performance in real time and provide focus on organizational or team KPIs
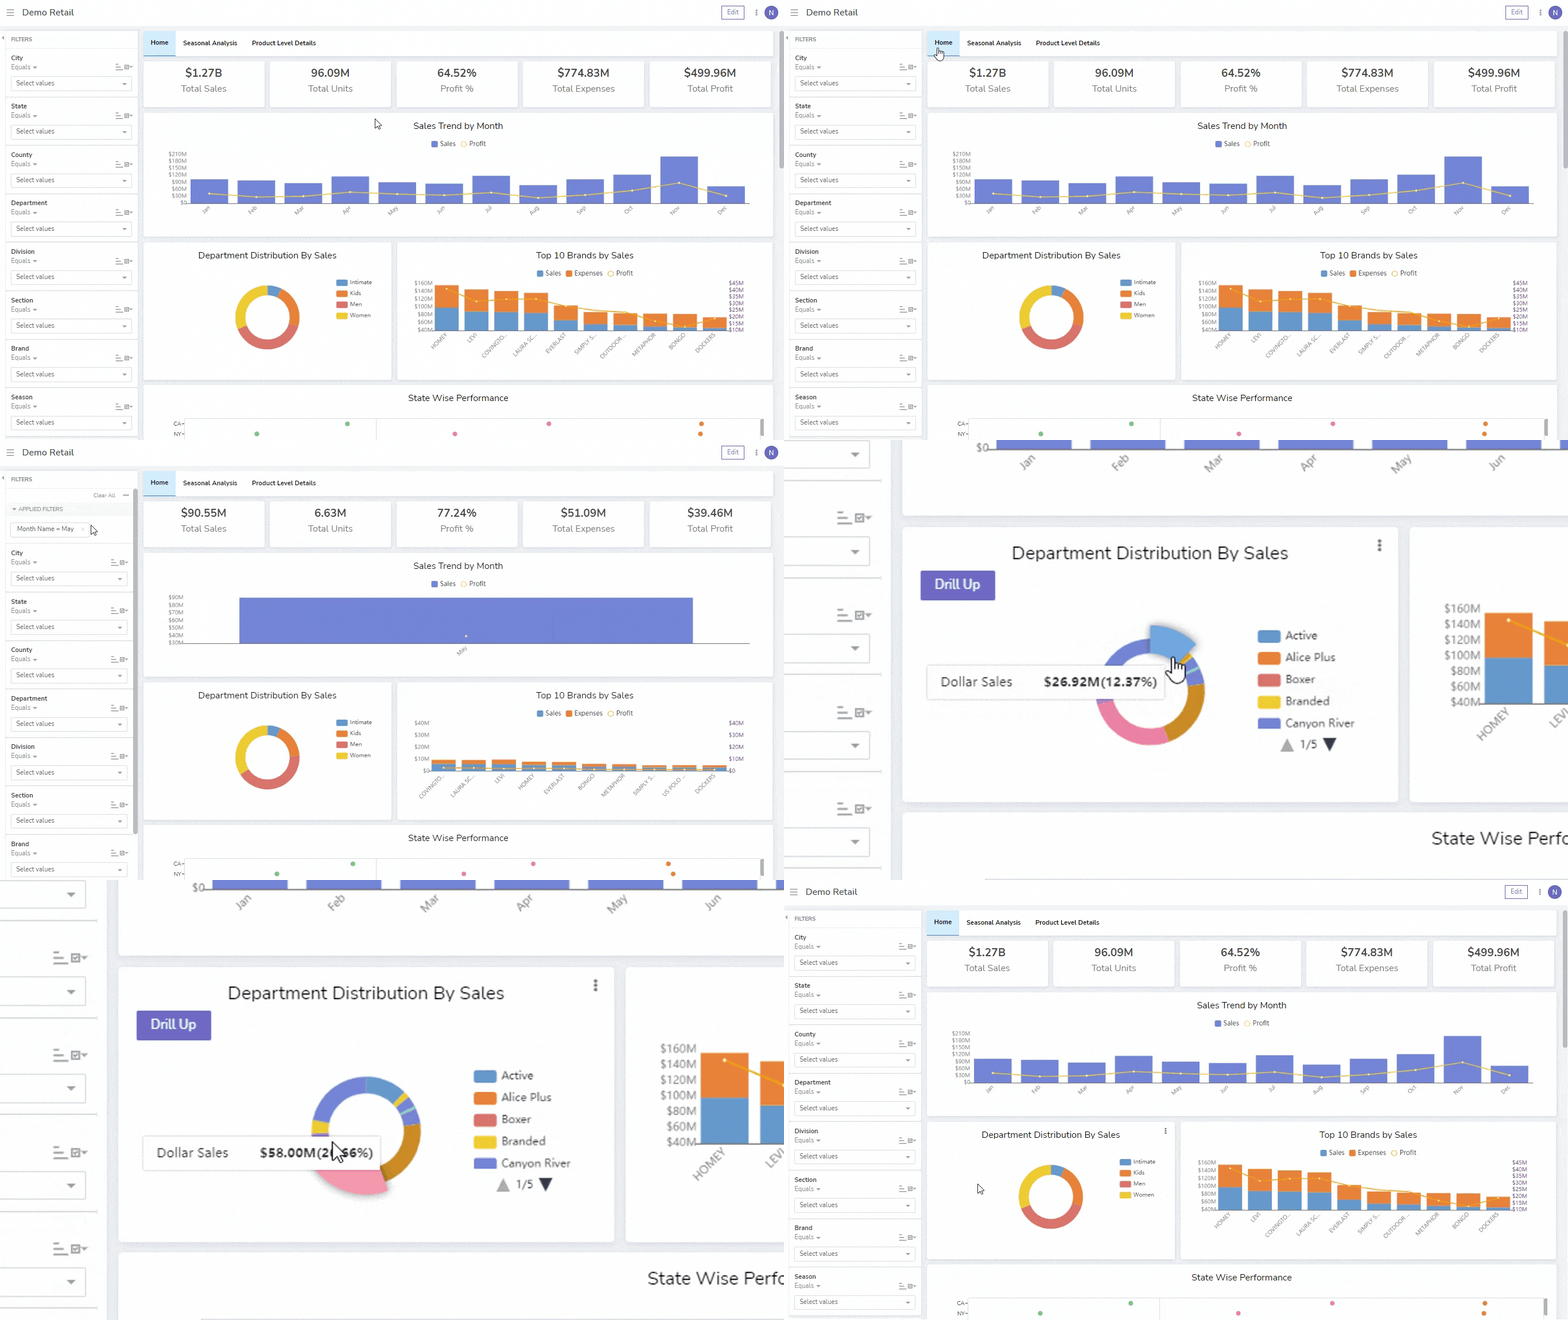
bipp allows creation and management of multiple dashboards that can be used to group and present one or many bipp reports.
They also allow data filtering across multiple reports and embedded dashboards and drill down into specific data points to view details.
bipp also provides a modern WYSIWYG editor for dashboard specifications.
Grid Charts display similar graphs or charts arranged in a grid which makes it easy to compare different slices of the data set
It allows for the display of rich, multi-dimensional data, enabling comparison across variables and revealing the range of potential patterns in the charts.
Unlike our competitors, bipp can create Grid Charts with millions of data points in the browser. This streamlines workflow by removing the extra step of publishing that traditional client-server architectures require.
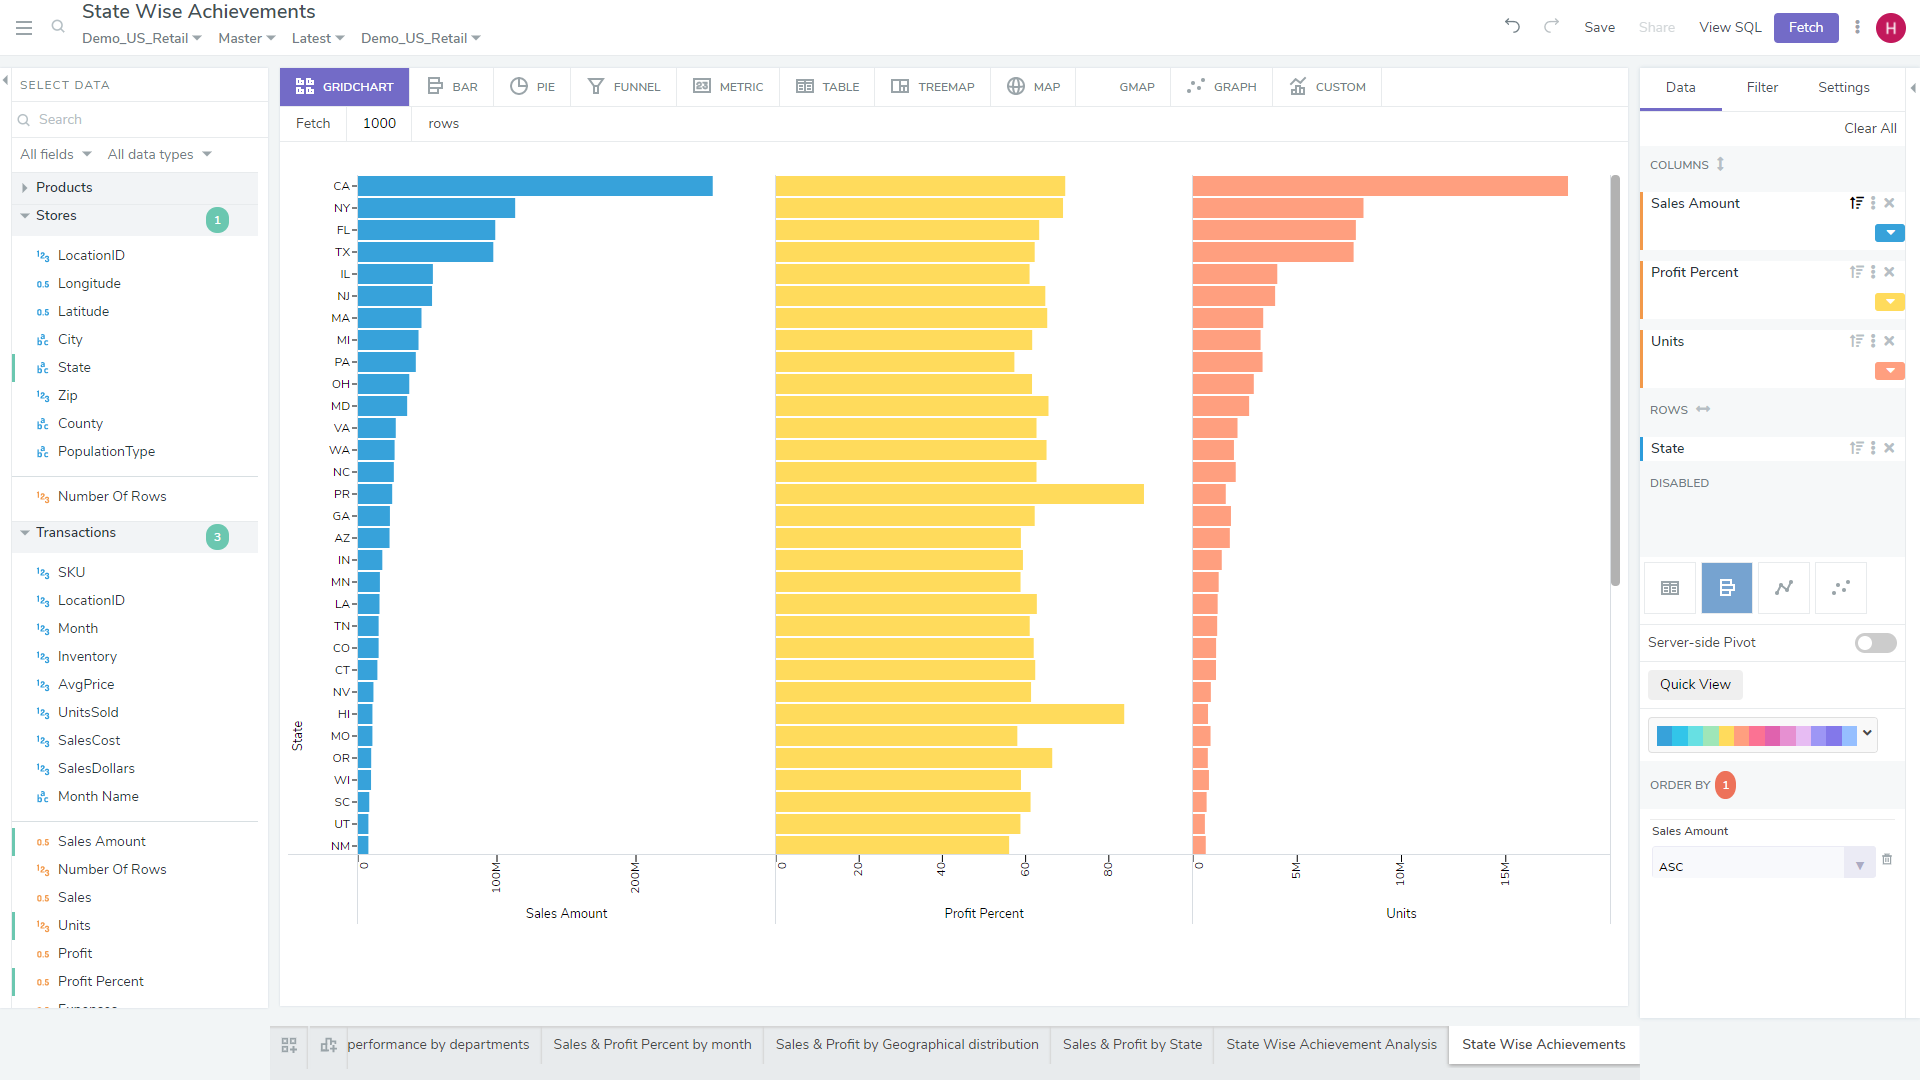
Grid Charts display similar graphs or charts arranged in a grid which makes it easy to compare different slices of the data set

It allows for the display of rich, multi-dimensional data, enabling comparison across variables and revealing the range of potential patterns in the charts.
Unlike our competitors, bipp can create Grid Charts with millions of data points in the browser. This streamlines workflow by removing the extra step of publishing that traditional client-server architectures require.
Real-Time Data Pictures That Tell Real Stories
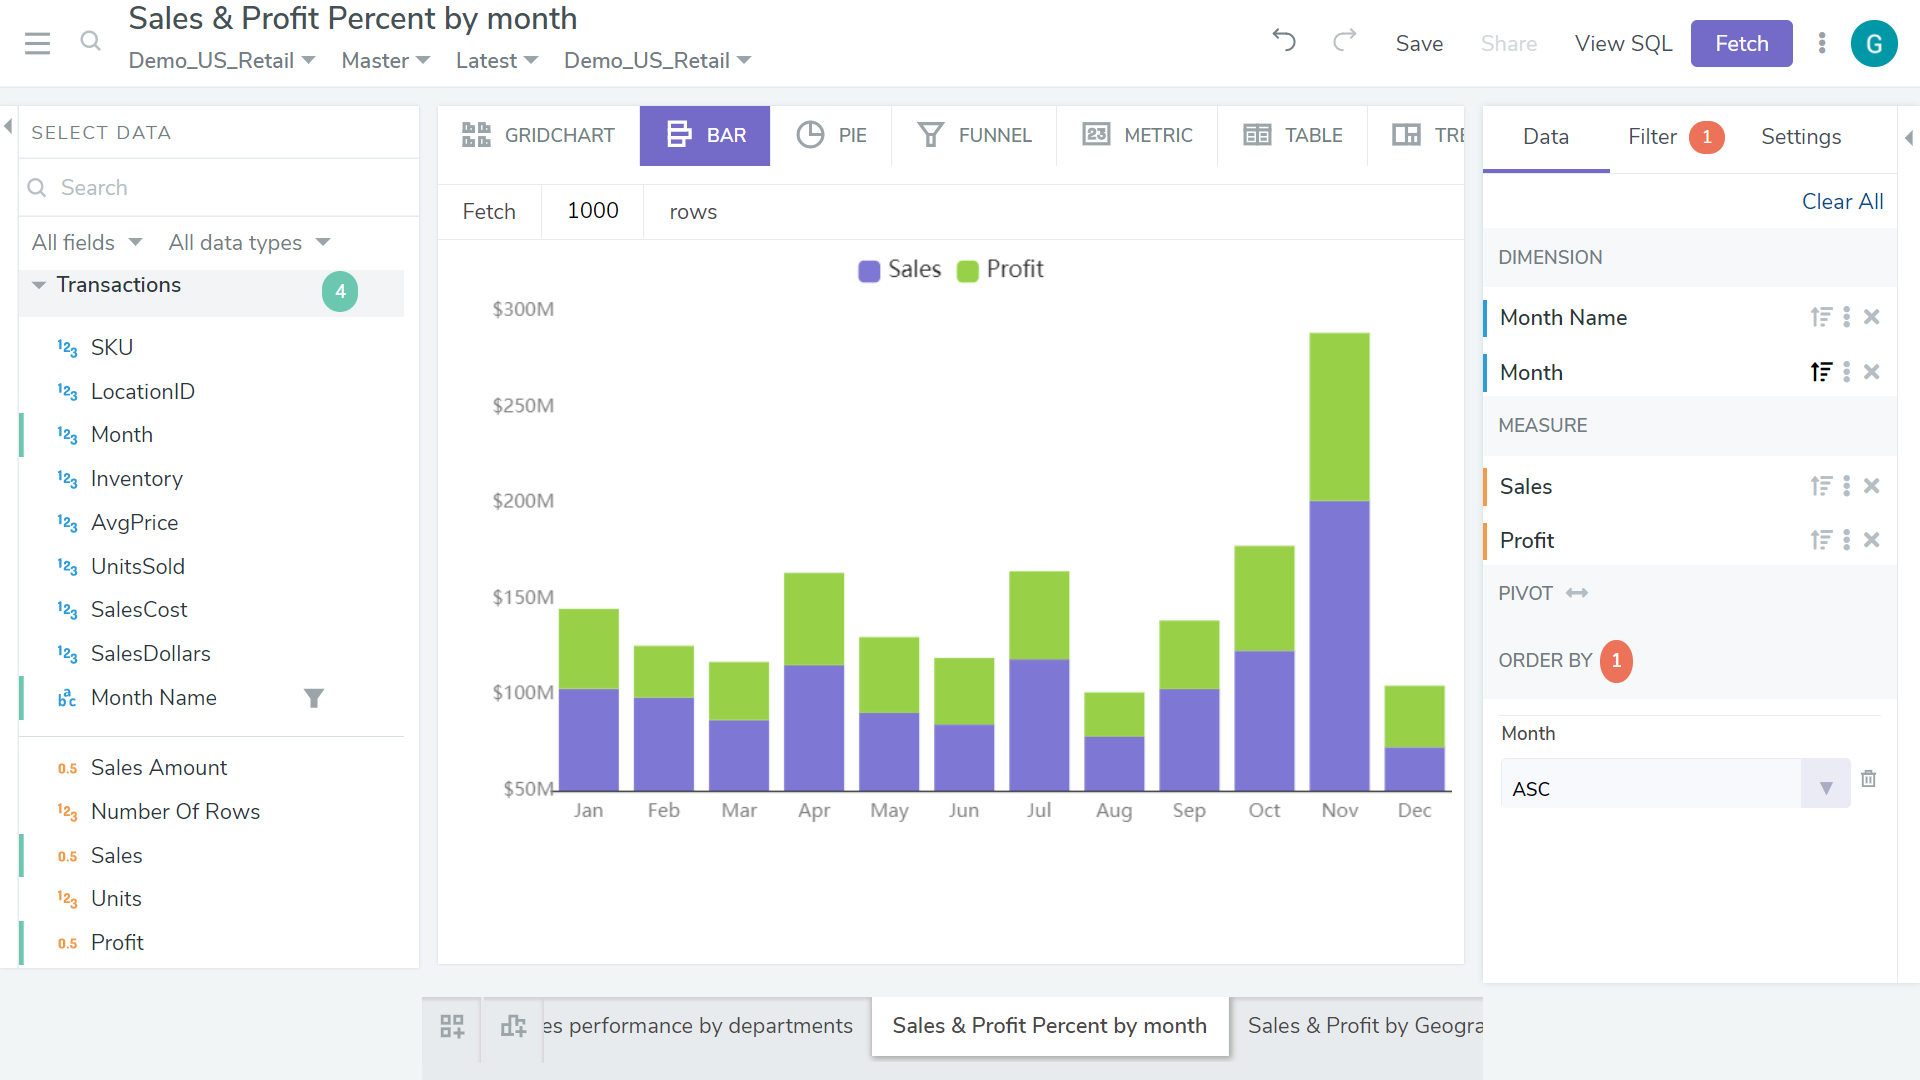
Bar Chart
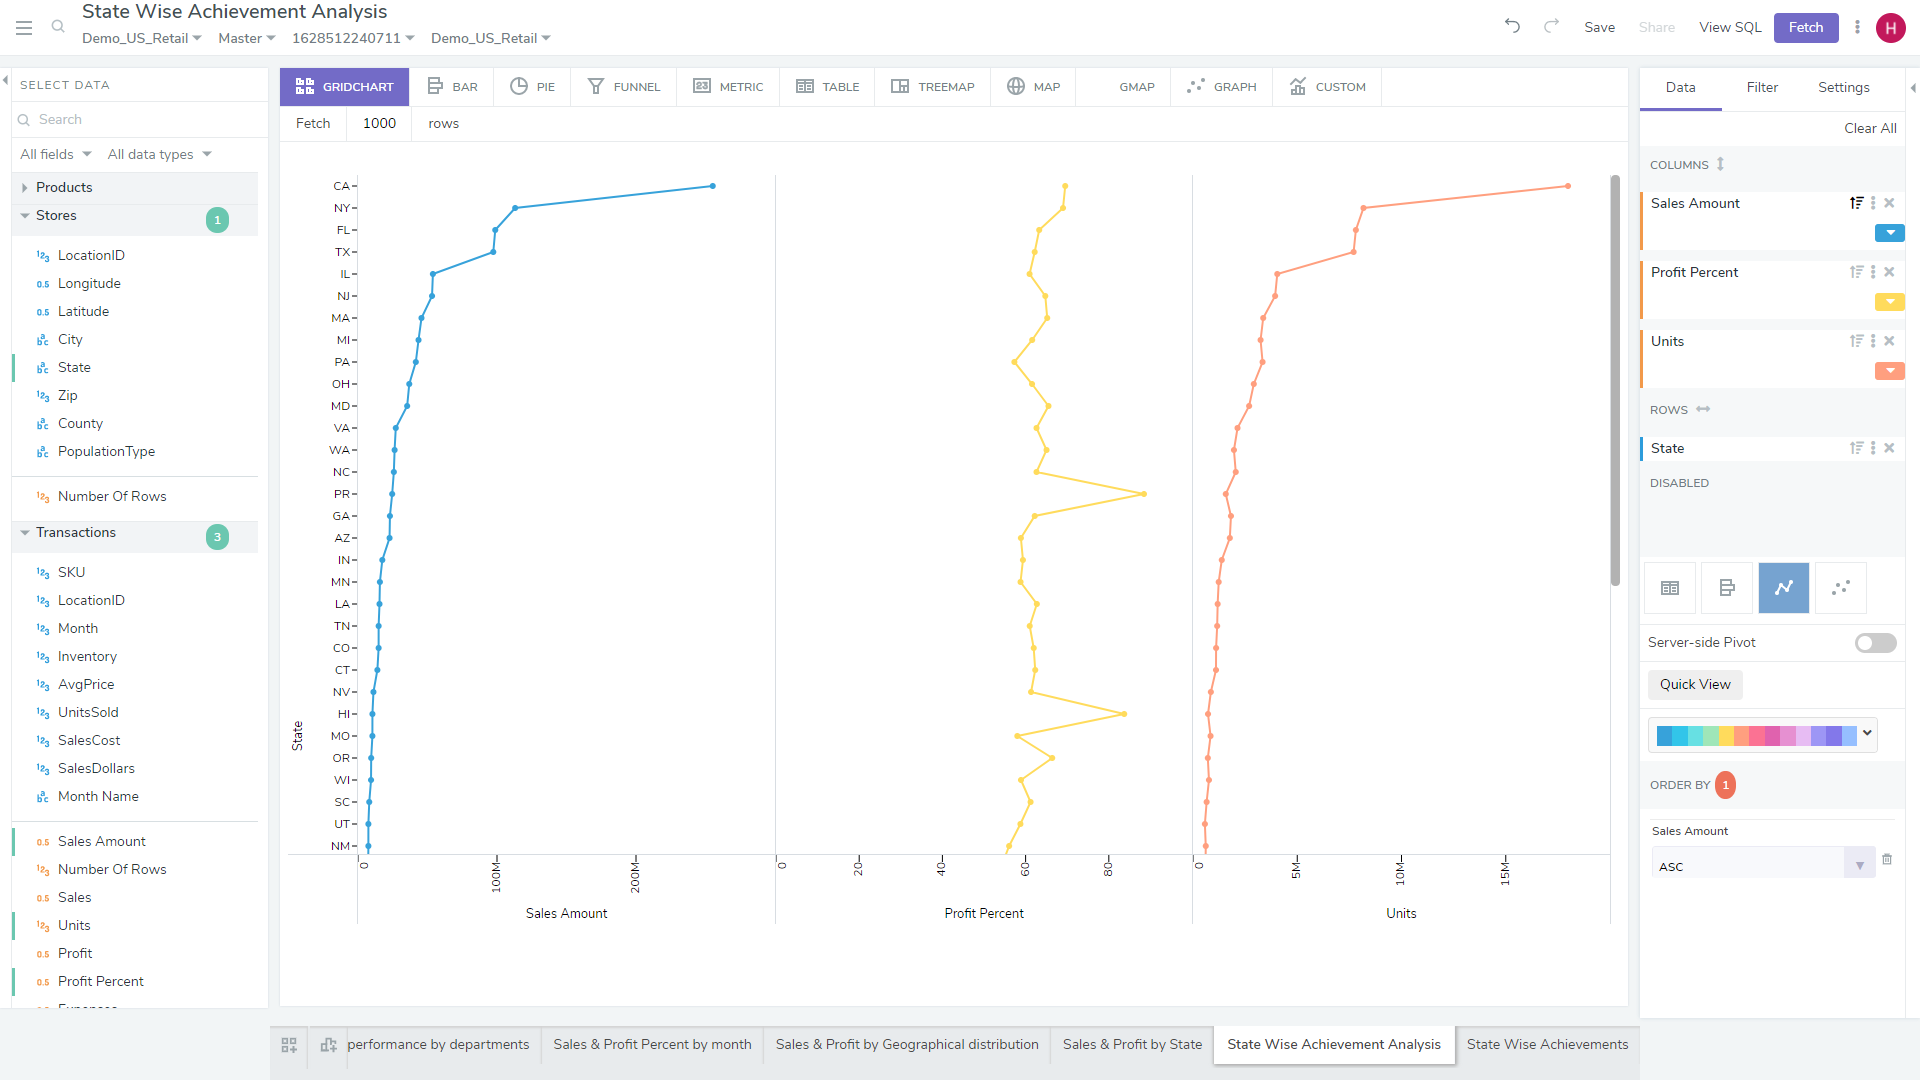
Line Chart
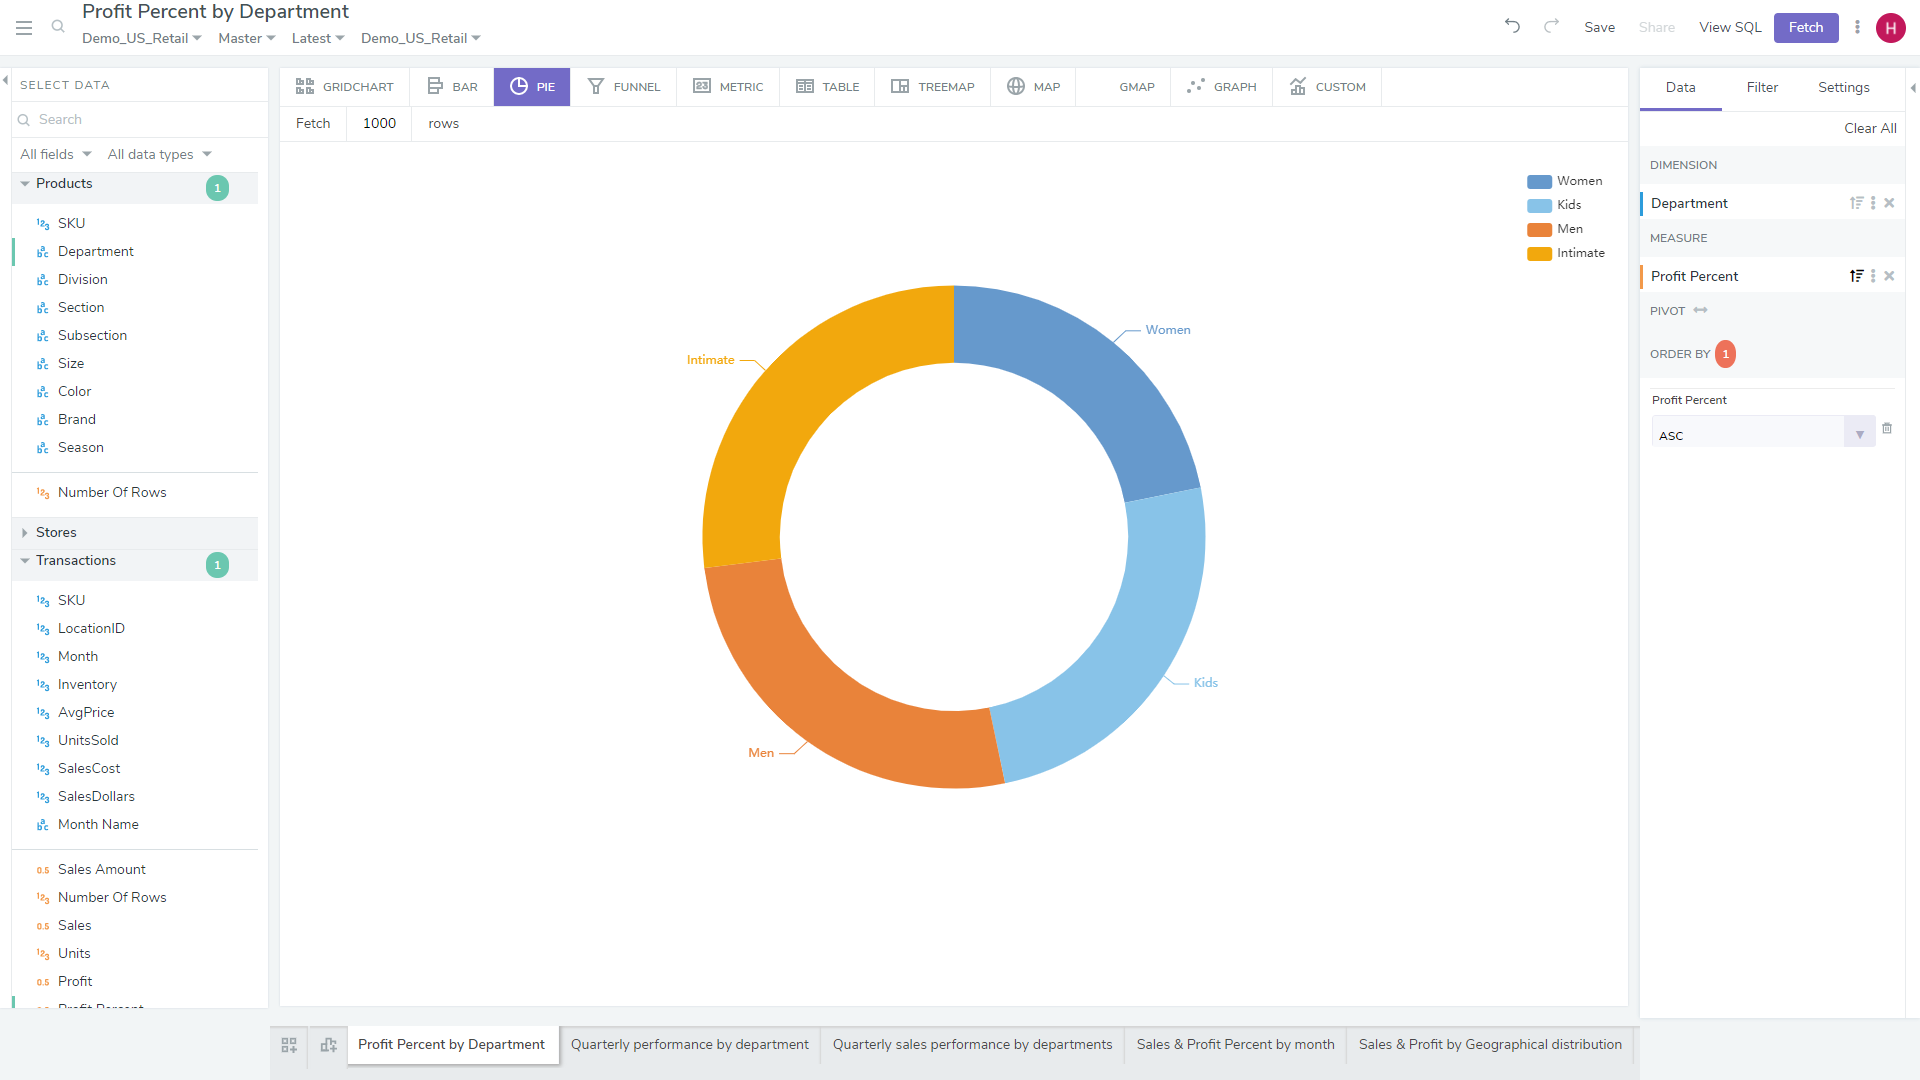
Pie Chart/ Donut Chart
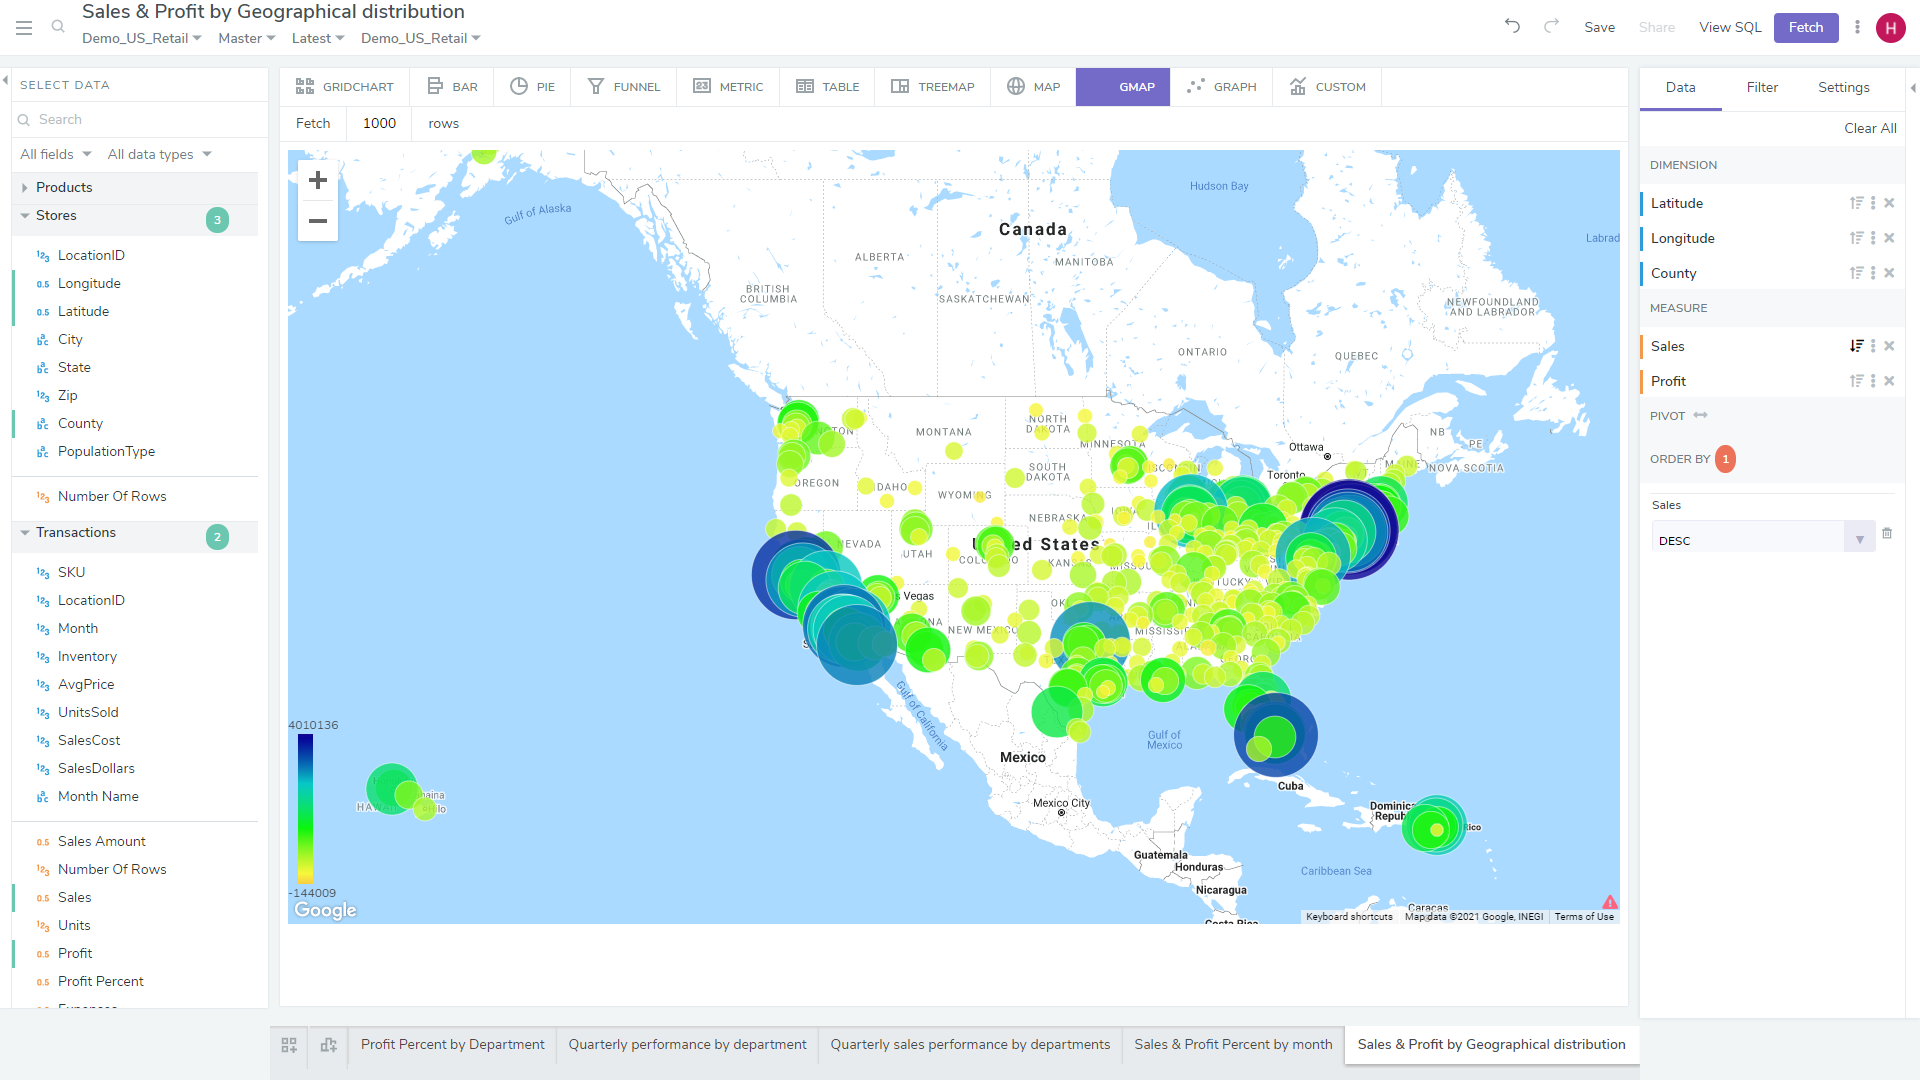
Map
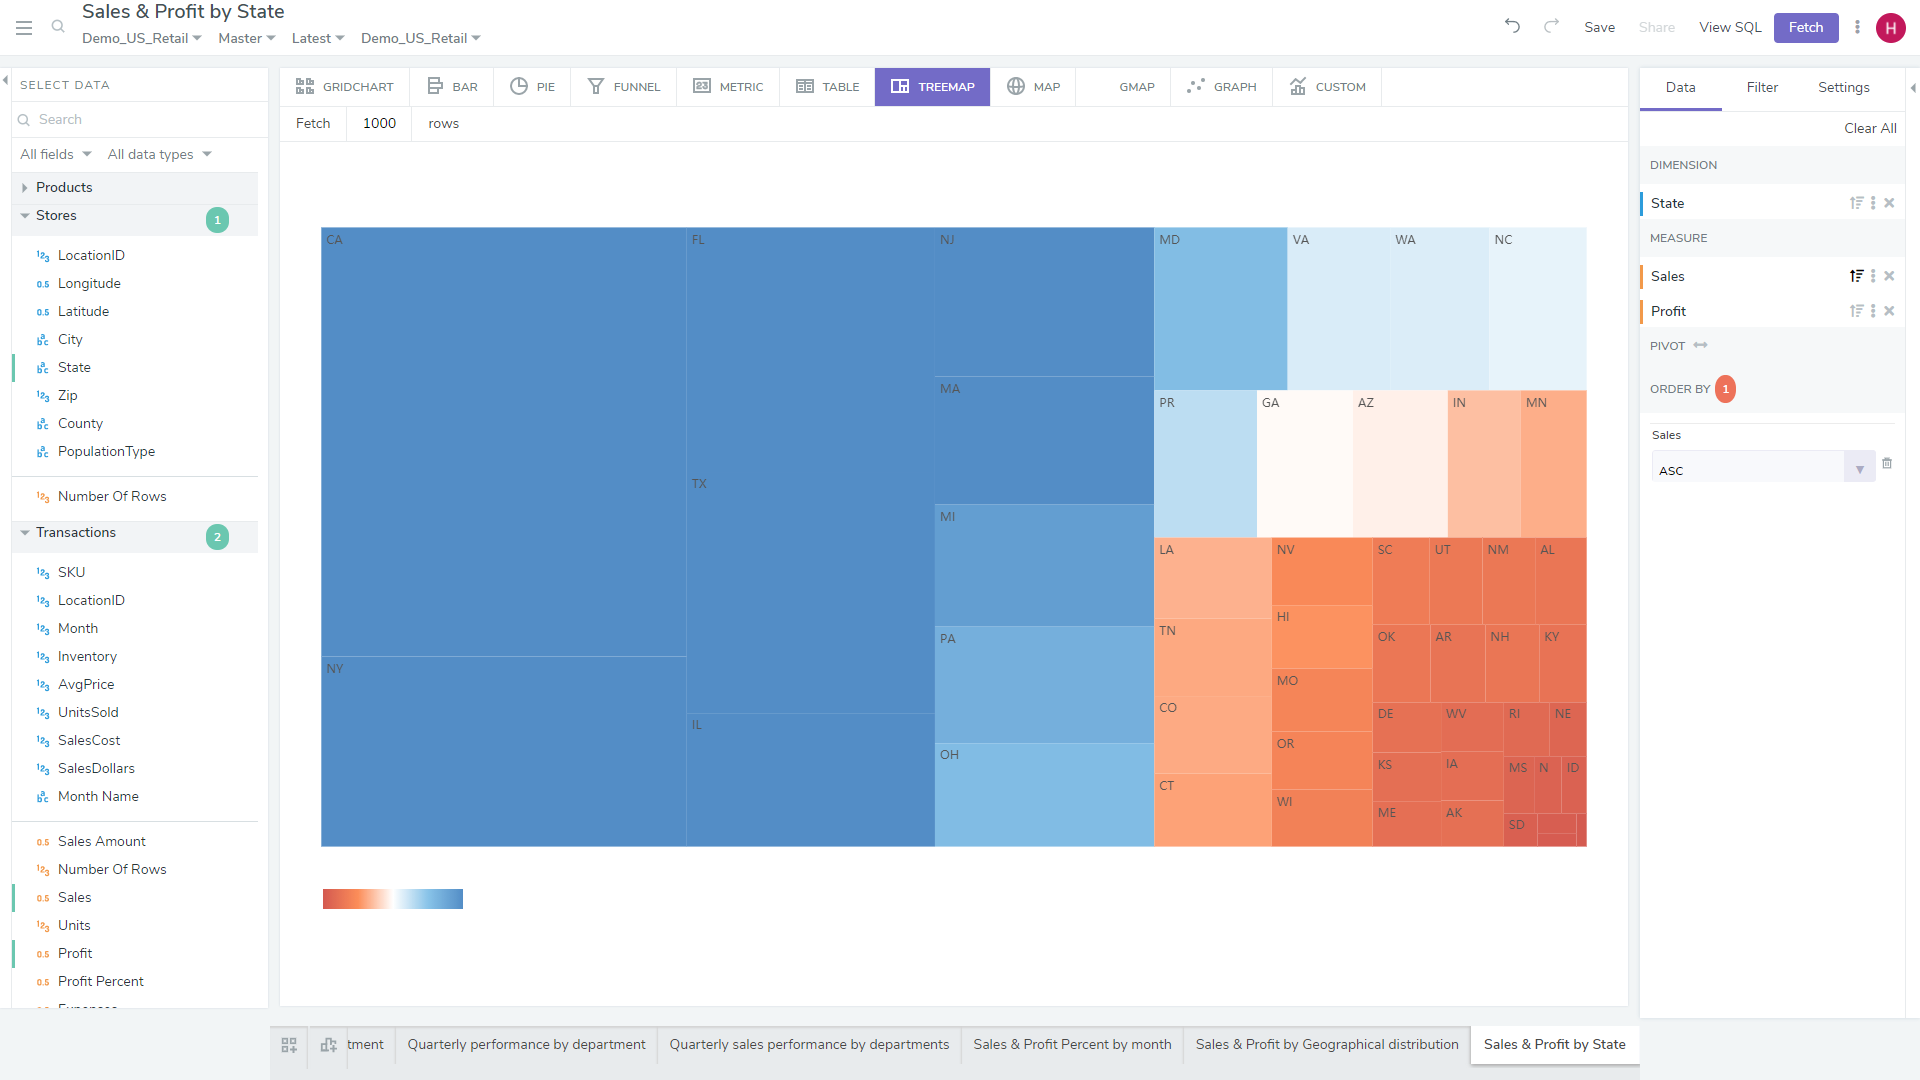
Tree Map
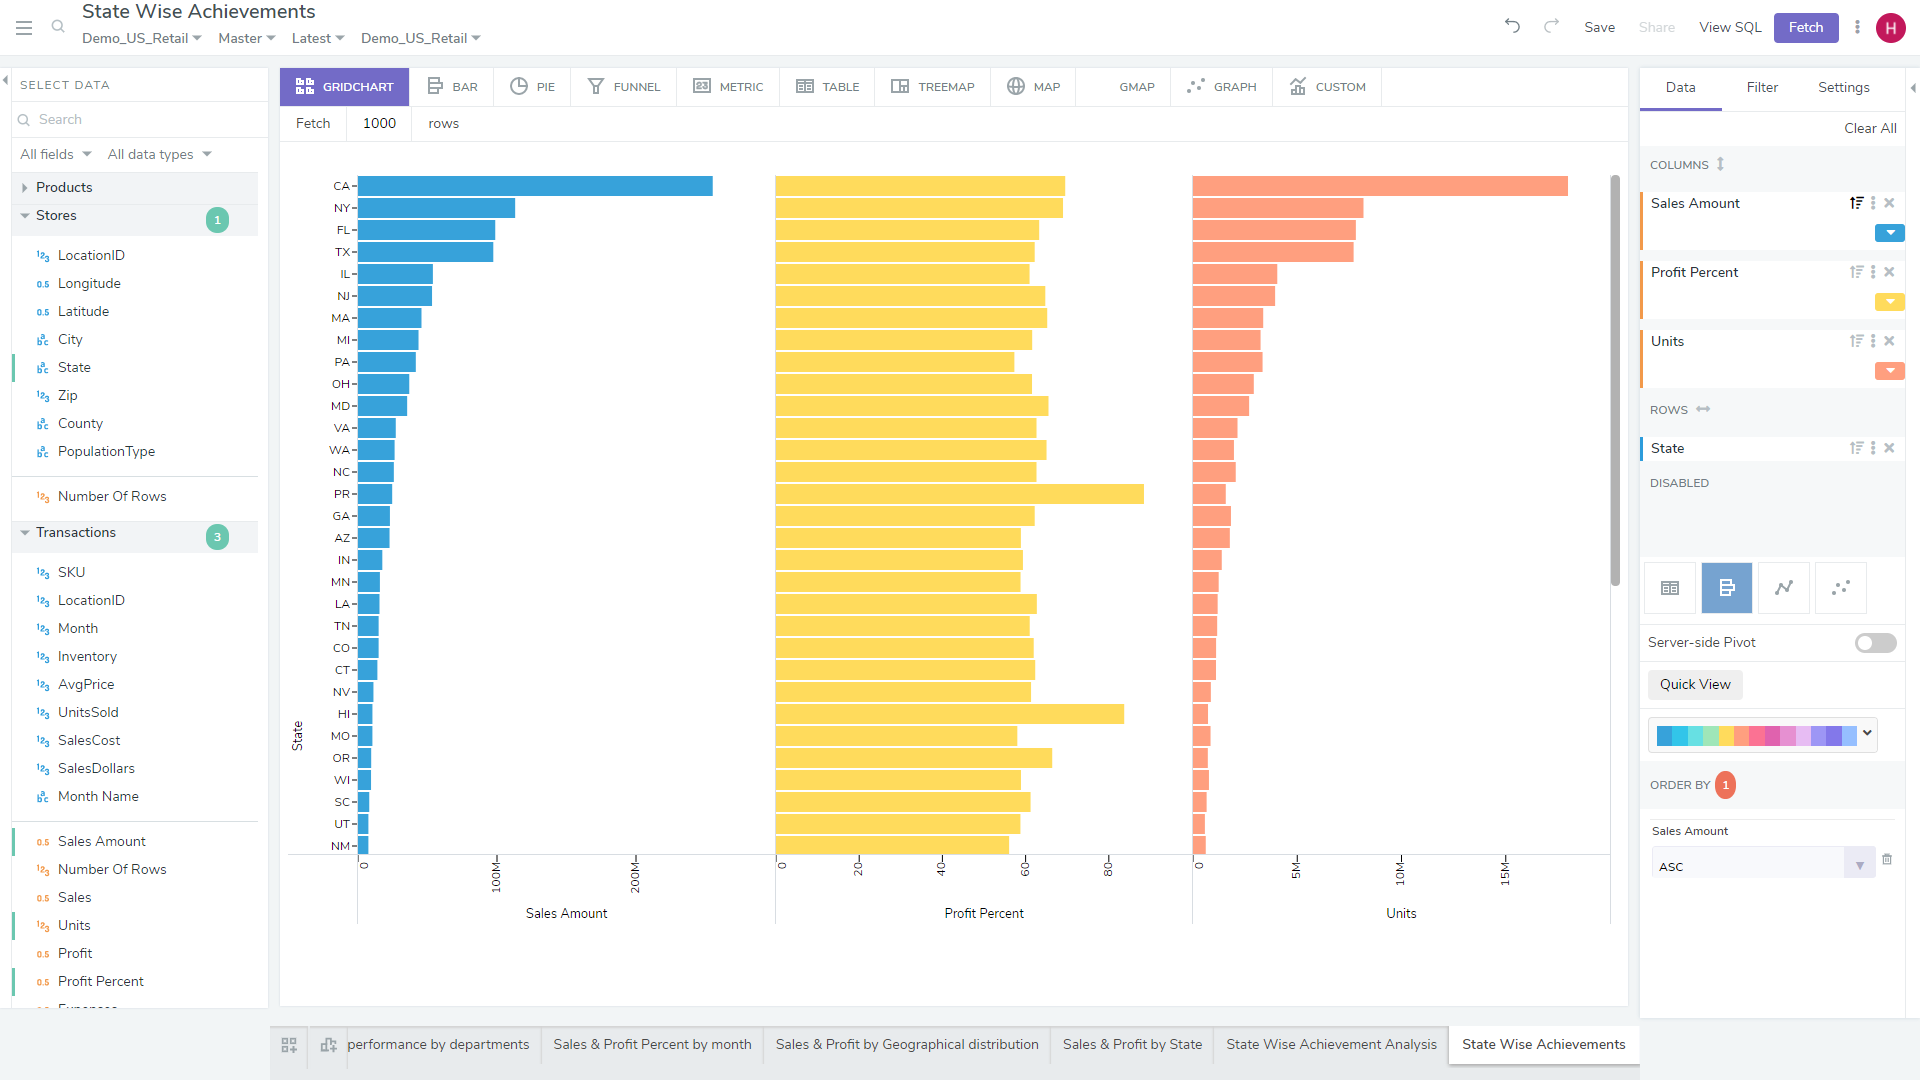
Grid Chart
bipp’s visualizations help business users make better informed, real-time decisions. Want to learn more?
