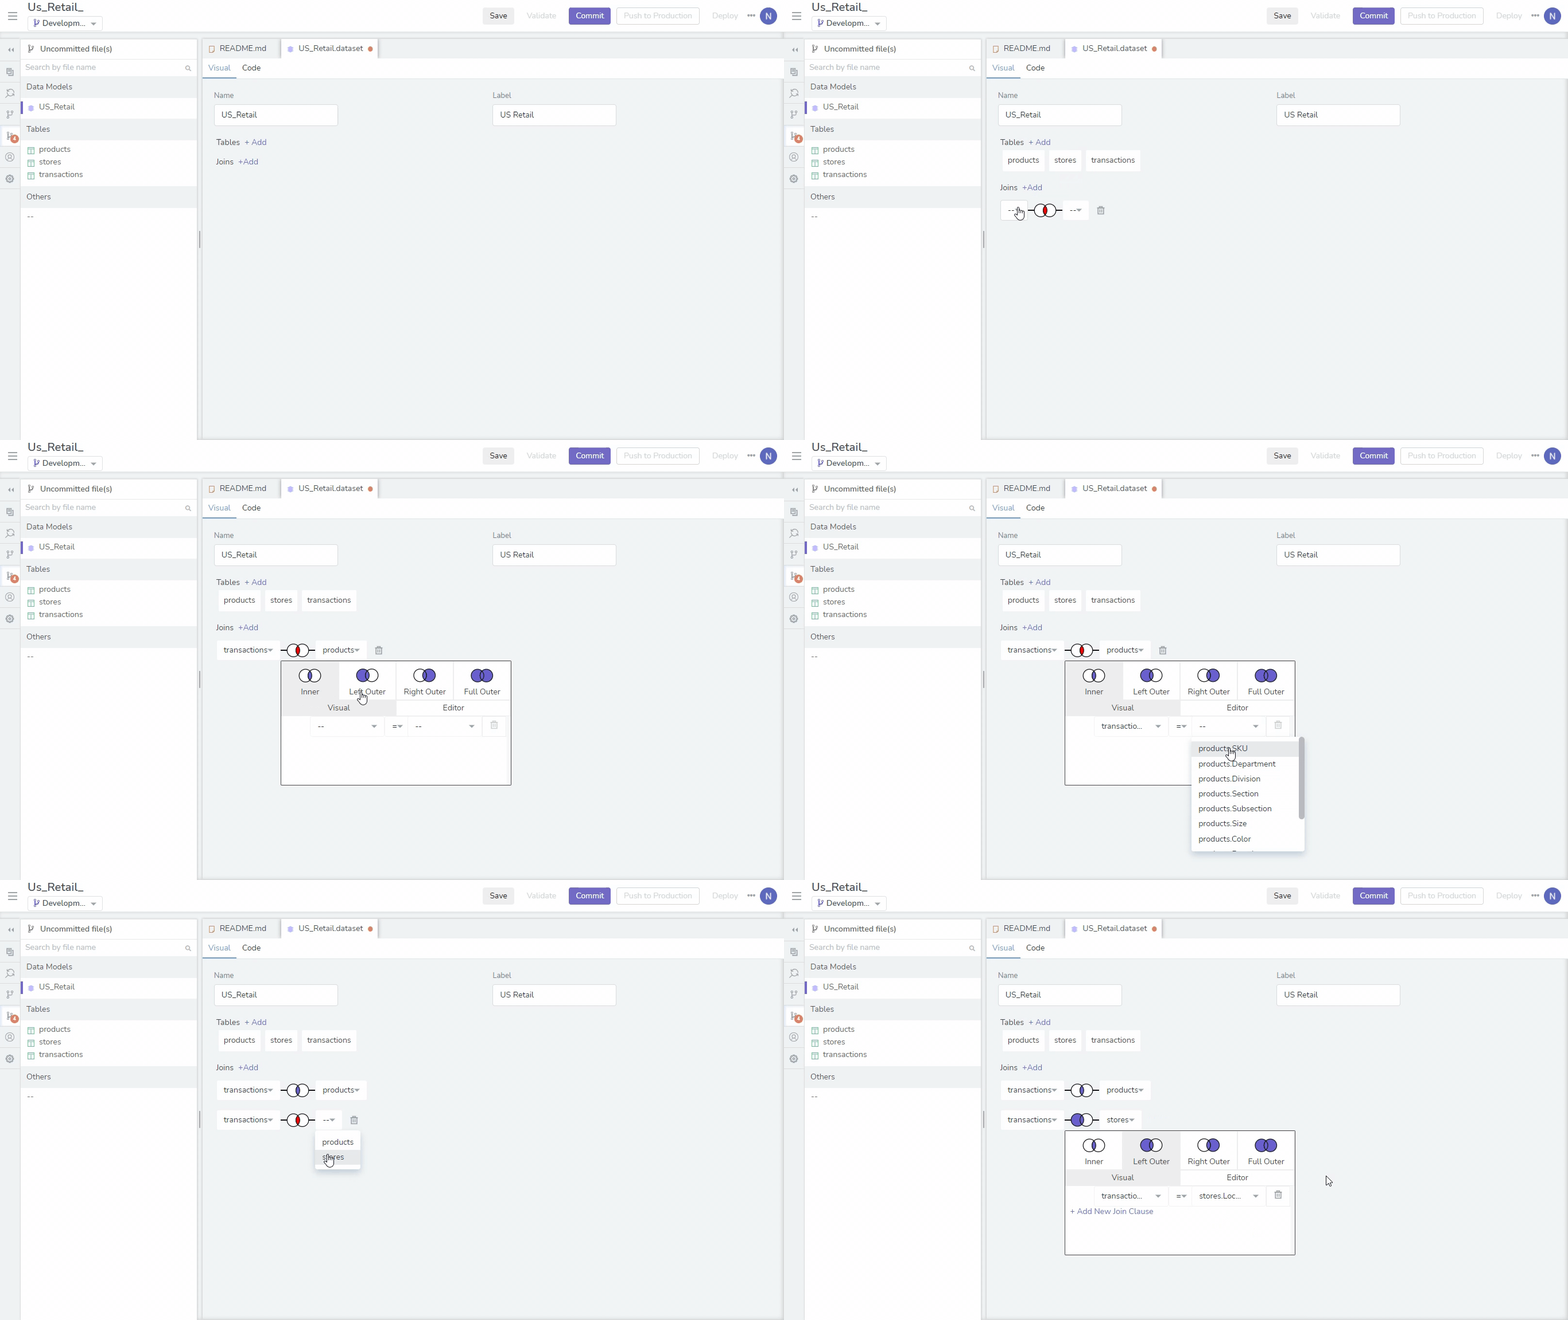
With just SQL, bipp’s Data Modeling Layer lets you build data models that can act as enterprise-wide single source of truth. On the other hand, Looker requires your technical team to learn new LookML language to do data modeling. Also, bipp offers Visual Data Modeling that lets you create data models using a powerful point-and-click visual interface which means no additional training or writing a single line of code!
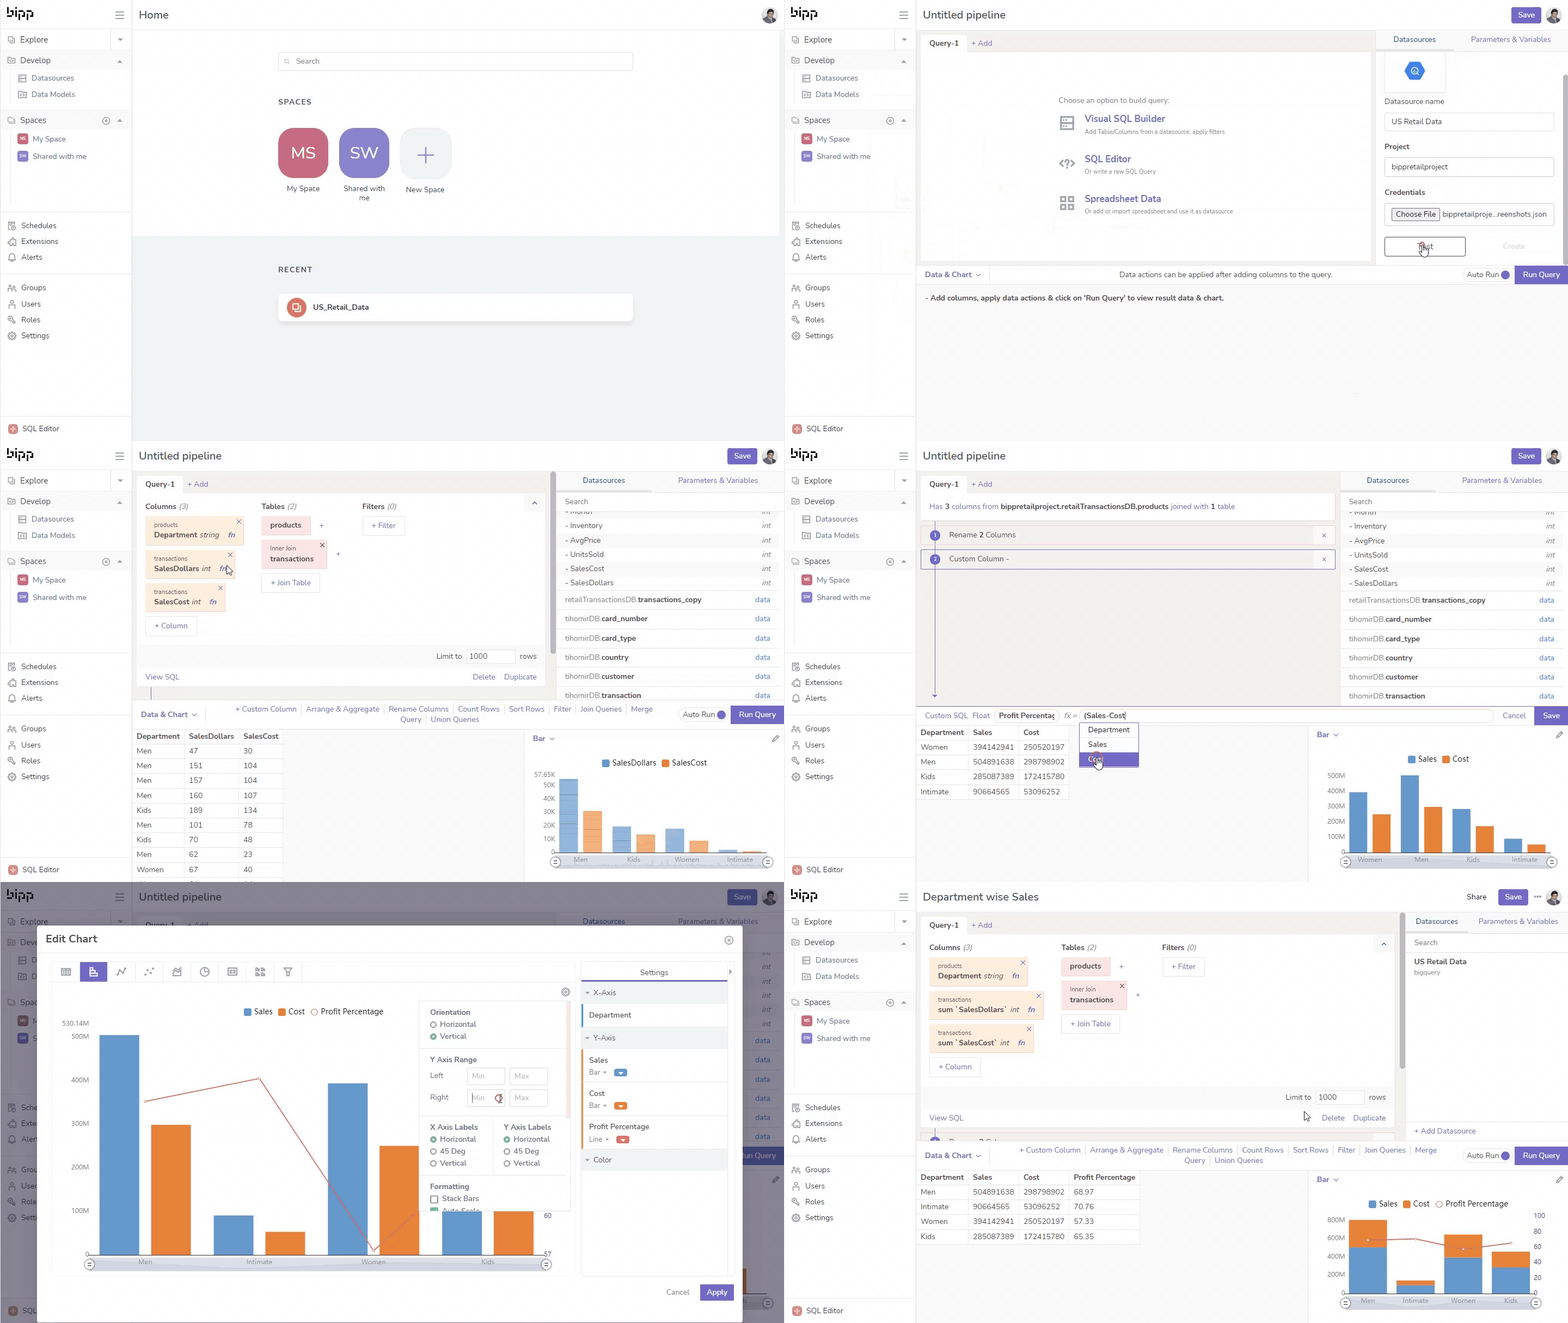
With bipp's Visual SQL, business users can visually query, explore data and create charts in minutes, without any programming, by just using an easy to use point and click interface. With Looker, you're locked into building data models, which might slow you down. bipp's Visual SQL is intuitive for business users, fast for power users, transparent for SQL professionals, and flexible for programmers.
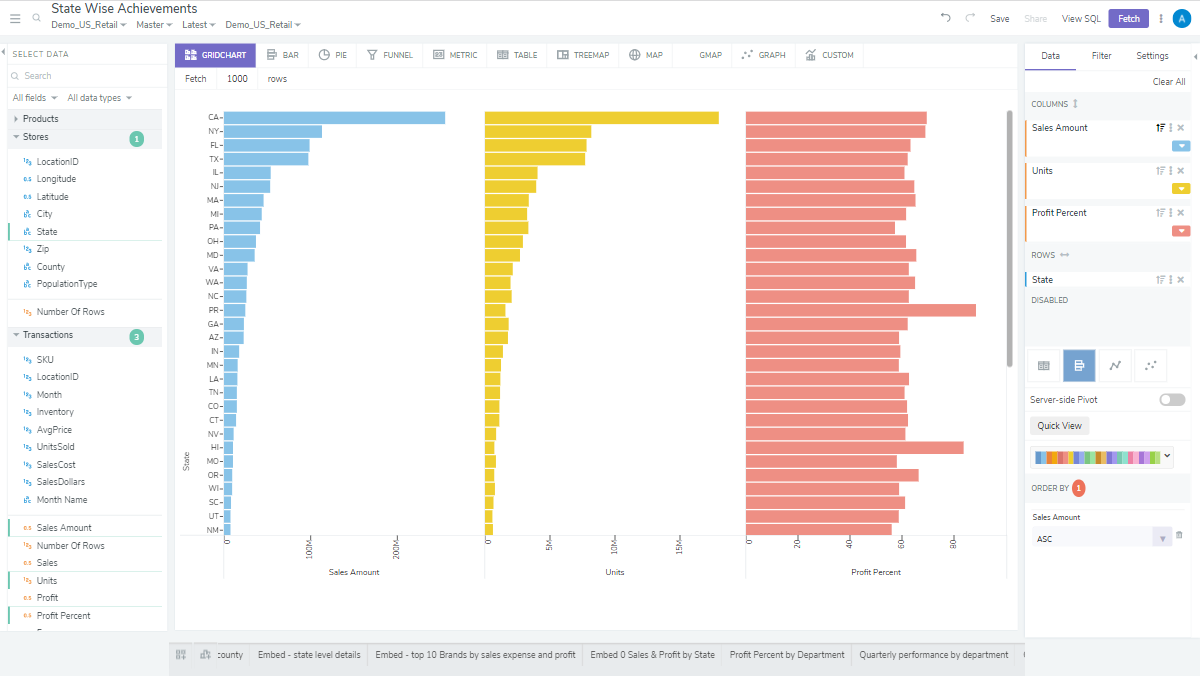
Unlike Looker, bipp offers a grid chart visualization functionality in addition to bar, line, and scatter plot charts. Grid charts display rich, multi-dimensional data, enabling comparison across variables and revealing the range of potential patterns in the charts. bipp streamlines workflow by displaying grid charts with millions of data points in the browser.
Our pricing model starts at $10/user/month, unlike Looker’s estimated cloud pricing of $50/user/month.
bipp's team has built a great solution and services. They have been the best among all the business intelligence vendors our IT team has worked with. We managed to replace Qlik in one of our business functions. Their data model technology helps us streamline our operations a great deal.
Director, Data Engineering and Analytics
A Fortune 50 healthcare company
Anuradha V
Founder and CEO
Small-Business (50 or fewer emp.)
Alex T
Head of BI
Mid-market (51-1000 employees)