bipp Dashboards Help F50 Healthcare Company Receive Lightning-Fast Drug Approval
A global healthcare company needed to fast-track regulatory approval for a new drug but struggled to accurately provide the required production, testing, and shipment metrics. Individual global manufacturing, testing, and distribution sites had used Excel and PowerPoint to store and present data, but the company needed a way to consolidate raw data across multiple sites into KPIs to share with regulators and executives. Using bipp, the company connected 17 sites into one platform, which helped them rapidly achieve drug approval in the USA and EU.
Company Data Points
- Fortune 50 healthcare company
- Operations in 60 countries
- Products sold in 175+ countries
- 125,000+ employees
- $14B+ annual revenue
- One of the world’s top 5 healthcare innovators
- Four divisions: Pharmaceuticals, Medical Devices, Consumer Products, Delivery
Overview
Pharmaceutical production creates unique challenges for healthcare companies as drugs are closely regulated and need to be tracked in an auditable way. bipp’s client, a Fortune 50 healthcare company, developed a new drug in 2020. It was required to prove to regulators and global customers that its supply chain fulfilled temperature requirements and that it could track a shipment’s location at each distribution step.
This drug presented unique challenges since the primary customers were governments who required the supply chain to be precisely monitored from factory to final delivery point. For instance, the healthcare company needed to ensure the drug remained within certain temperatures throughout the manufacturing and delivery process. Furthermore, the company’s existing supply chain had to be modified to satisfy production demands while streamlining delivery. Finally, the company needed a concise way to display production and distribution KPIs so regulators, government authorities, and internal stakeholders could monitor every supply chain step in real-time.
bipp’s solution consolidated KPIs from multiple sites into a single dashboard, which helped the healthcare company achieve regulatory approval in the USA and EU. In addition, thanks to bipp’s real-time reporting capabilities, the company could track the precise location of every drug package in the world at any point, from manufacturing to delivery.
Challenge
Each of the company’s 17 worldwide manufacturing and distribution sites had similar data but stored it in different formats. Shipments were also combined and split up at intermediary facilities, which generated 12.4 million rows and 80 columns of data. Each site had also developed different rules dictating how metrics should be calculated from specific tables or what tables could be joined, making it impossible to get an aggregated view of critical metrics. These challenges made it impossible to consolidate raw data for regional or global monitoring.
Therefore, the company could not centrally track and consolidate KPIs such as shipment origin, destination, estimated arrival time, ID number, nor graphically display the drug’s progress through the supply chain. In addition, since they could not accurately track shipments between warehouses, a small but noticeable number of packages went missing each quarter.
The company also wanted automated alerts when critical KPIs were achieved and customized visualizations to help them monitor shipments. Unfortunately, neither could be set up using Excel.
The only solution was to create a shared platform based on a single, reliable, cross-enterprise source of truth for aggregating and reporting on data from multiple sites.
Solution - bipp Supply Chain Dashboards
The healthcare company required bipp to create the initial dashboards in less than 24 hours in order to demonstrate its drug production and supply chain KPI monitoring to senior government officials. bipp’s professional services team quickly consulted with business users, including supply chain directors, planners, business intelligence directors, logistics managers, and project leaders, to build the proof of concept.
bipp developed a plan to consolidate databases in MSSQL, then built ETL processes to bring that data into a single source. bipp also developed integrated tools to connect different data sources, including SAP data. It built a data modeling layer that captured critical business logic while connecting SQL databases with data exploration and reporting tools. bipp’s analysts wrote SQL queries against raw tables and used bipp’s data modeling language to build data models for KPIs and custom visualizations leveraging Google Maps. Designing the model within bipp made it easier to perform calculations and reveal multiple insights using the same model while optimizing computational performance.
In parallel, bipp developed the best way to visualize KPIs by sketching wireframes with the data points users needed, a map of the supply chain, and a flow diagram. To quickly bring it to life, bipp developers leveraged a dashboard build from another of the client’s teams and created custom visualizations using Google Maps to demonstrate real-time tracking. The team used JavaScript, HTML, and CSS to build the custom visualizations. To deliver updates in real-time and speed up reporting, bipp only fetched the data needed at the time. This required no Python or other coding since it was fetched from the main dashboard.
Analysts then ran test cases to ensure the data was consistent across sites, created visualizations, combined them into reports, then built and deployed custom dashboards. They consisted of an executive summary of the drug production and supply chain process and two dashboards displaying charts for 25 KPIs.
For example, the dashboard could display each unique drug shipment’s temperature and location data based on a beacon. This information connected automatically to the platform, which displayed the origin, destination, estimated arrival time, ID number, and a visual display of the route. The client’s site-level managers used this to see how the shipment was progressing. bipp analysts also configured automated alerts for notifications for events, including when a package was out of range, delayed, or stalled.
bipp’s new platform meant executives and regulators could now oversee the drug supply chain with the required level of detail.
Results
With bipp dashboards in place, the company’s executives demonstrated they could create, test, and deliver the drug and meet regulatory standards. Governments in the USA and EU approved the drug, the company signed agreements and began shipping.
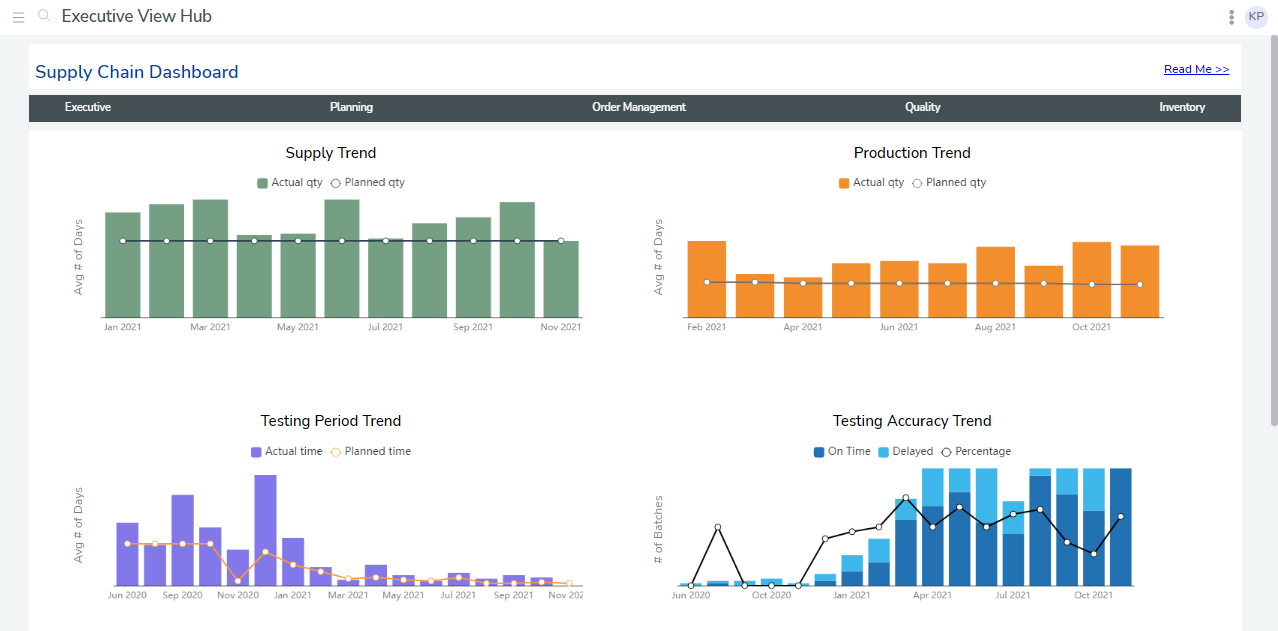
The dashboards went live at 17 manufacturing, testing, and shipment sites. When executives logged in, they saw a summary of KPIs, such as target and actual production. In addition, they could click through sub-dashboards to see quality control, inventory, and order management.
Each site’s dashboards were 70-80% the same, which simplified onboarding new sites. bipp analysts simply modified and validated data and made custom amendments to visualizations based on user preference (such as disabling horizontal scrolling). bipp’s in-database nature and data modeling approach also allowed analysts to fine-tune data fetching, so visualizations showed shipment locations with data accurate to five minutes. Furthermore, with real-time tracking of every package in their global supply chain, the number of lost packages dropped to zero.
The company’s management used bipp dashboards to inform decisions such as evaluating supply routes and making operational decisions in real-time. Managers shared this information with business users using bipp's Scheduled Reports feature, which generated and emailed a dashboard PDF when KPI thresholds were met. Towards the end of the project, bipp analysts focused on developing KPIs and dashboards and handed data management over to the client.
The Last Word
Organizations with regional, national, or global footprints often struggle to gain aggregate views of their operations. As a result, their business intelligence journey typically begins with ad hoc dashboards and presentations developed at each site. This solves the immediate visibility problem for site-level managers, but it fails to extract the full value of data across sites.
bipp’s modern business intelligence platform allows organizations to consolidate data from multiple sites into a single platform, using business logic defined in a data model that functions as a single source of truth. This model can be leveraged and customized to onboard new sites quickly. In addition, it’s designed for data analysts using best practices of modern software development and allows teams to customize dashboards beyond what’s possible in other BI platforms.
Interested in seeing bipp’s data modeling functionality for yourself? Contact us for a complimentary demo, or sign up for your free trial here.


